Results for {phrase} ({results_count} of {results_count_total})
Displaying {results_count} results of {results_count_total}
More results…
Results for {phrase} ({results_count} of {results_count_total})
Displaying {results_count} results of {results_count_total}
More results…
By Gabriel Cohen | Article/Editing: Niccolo Conte | Graphics/Design: Miranda Smith 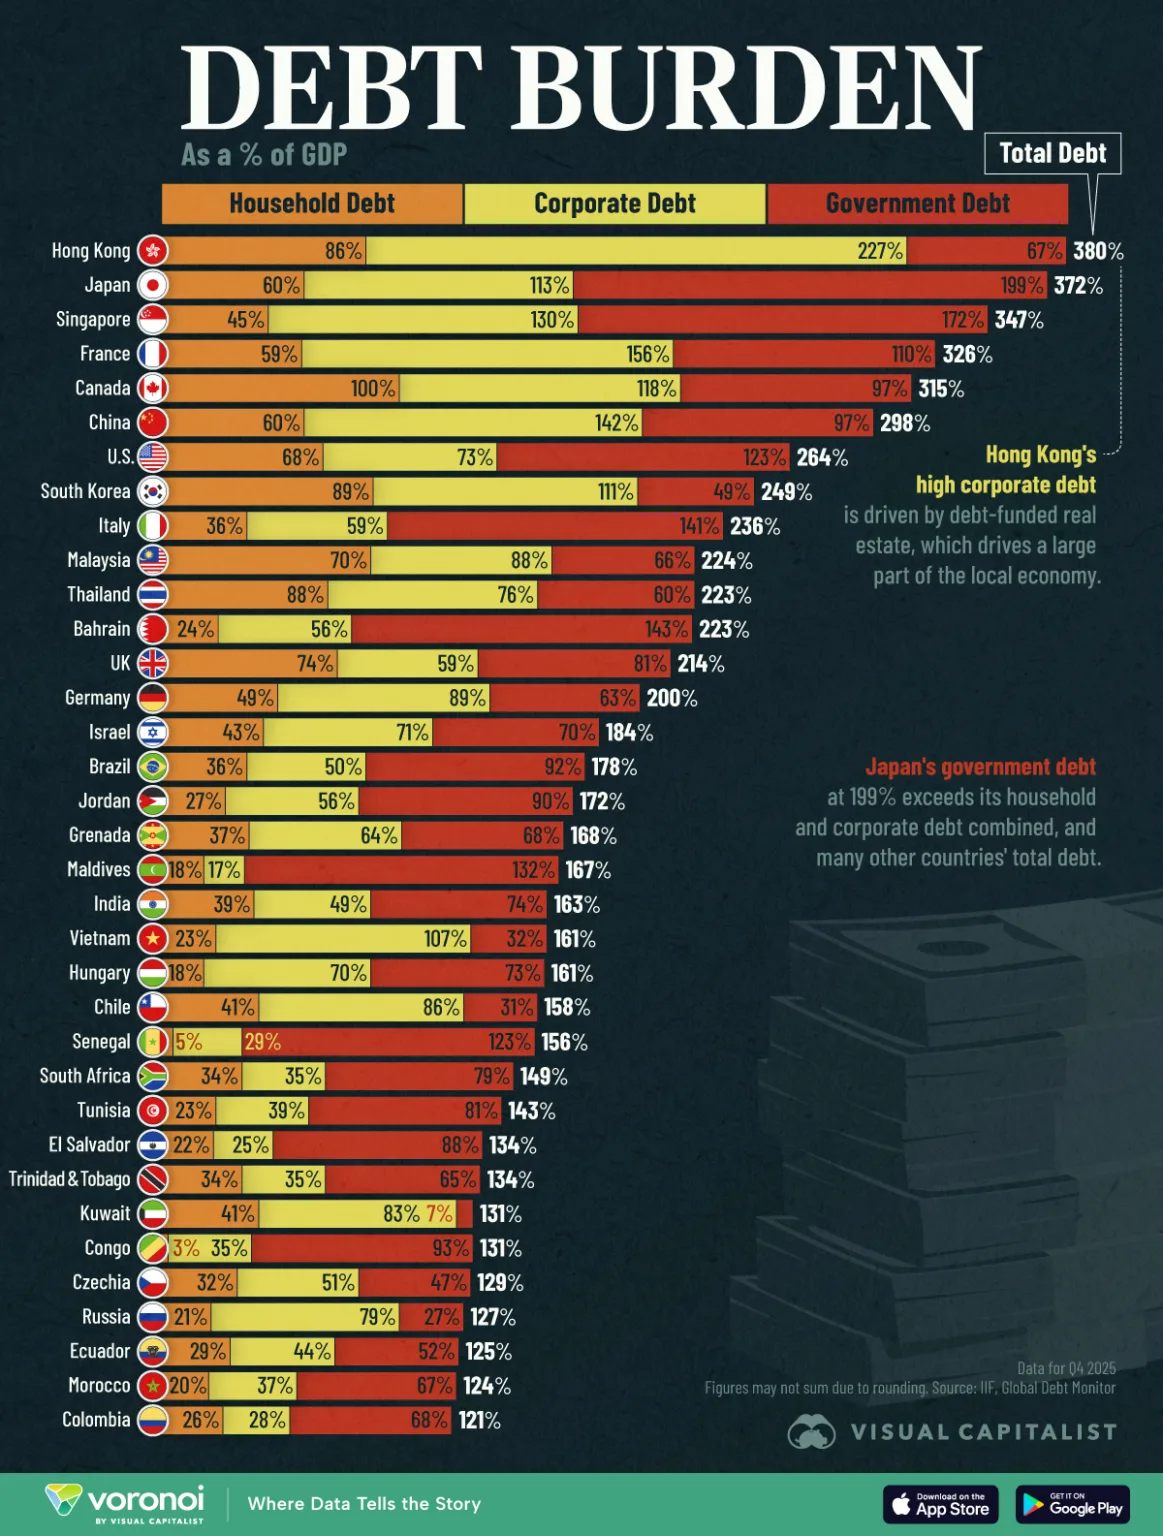
Key Takeaways
- Hong Kong ranks first with total debt equal to 380% of GDP, followed by Japan at 372%
- The U.S. ranks seventh at 264%, led by government debt (123%) and corporate debt (73%)
How indebted is your country today?
Get the Latest US Focused Energy News Delivered to You! It’s FREE: Quick Sign-Up Here
Based on the latest available data (Q4 2025) from the Institute of International Finance’s Global Debt Monitor, several major economies now carry total debt loads exceeding 300% of GDP, meaning their combined household, corporate, and government borrowing is worth more than three years of economic output.
This visualization ranks 35 countries by their total debt-to-GDP ratios, combining household, corporate, and government borrowing into one measure.
Hong Kong Tops the Ranking
With a total debt burden of 380%, Hong Kong has the world’s highest total debt. This small special administrative region (SAR) of China is highly developed and urbanized, counting roughly 7.5 million inhabitants.
While its government debt is a relatively slim 67% and its total household debt of 86% hovers around global developed-country standards, Hong Kong’s corporate debt is a staggering 227% of GDP, making up nearly the entirety of its total debt burden.
The table below shows the total debt burden and breakdowns for household, corporate, and government debt to GDP:


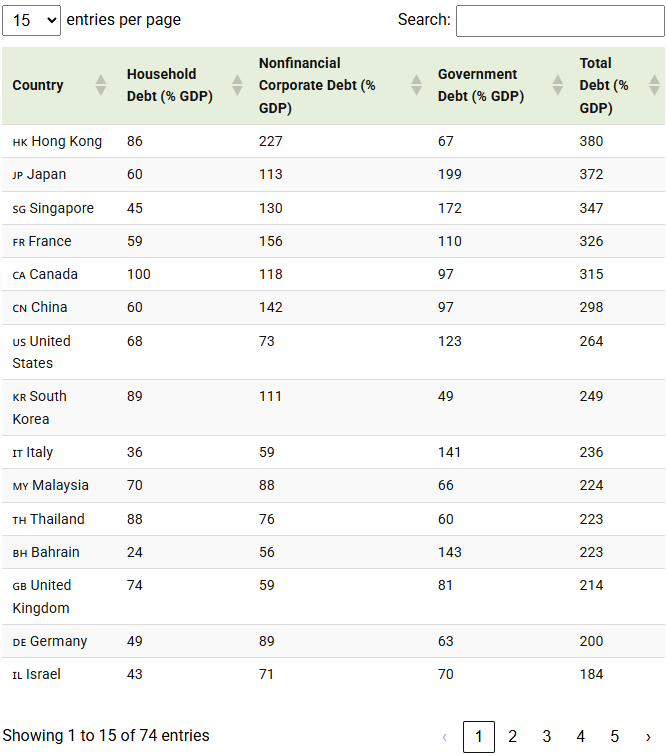
However, Hong Kong’s high corporate debt can best be explained by the SAR’s real estate business, in which high-debt transactions are standard. The dynamic real estate sector and related activities contribute roughly a quarter to Hong Kong’s GDP.
Japan’s Government Debt Nears 200% of GDP
In contrast, Japan’s corporate debt (113%) is relatively in line with other OECD and developed peers; however, the government’s sprawling government debt of just shy of 200% of GDP is higher than many countries’ total debt burden.
Government debt woes began to take off following the Lost Decades of economic stagnation which followed the collapse of the Japanese asset price bubble in 1991.
As years of sluggish growth turned into decades, Japanese policymakers opted to incorporate quantitative easing, a policy by which the central bank bought government bonds in order to stimulate economic activity in the country, driving up the country’s national debt in the process.
Today the Bank of Japan owns roughly half of the national debt, while the other half is held in large part by domestic banks and insurance companies.
Debt in the Developed World
Japan is not the only country to have had to accrue debt in response to tough times. Back-to-back crises have forced governments to borrow extensively in recent years, from global COVID-19 stimulus responses to more recent industrial and defense purchases across Europe.
Many governments continue to run large fiscal deficits, while households and businesses face rising borrowing costs amid economic uncertainty.
Share This:
More News Articles
FEATURED EVENT


VIEW ALL COMMODITIES
EnergyNow.com is an energy news media service dedicated to providing information on the U.S. energy sector’s latest news, technology, innovations, commentaries, events, data and press releases. From oil & gas, to renewables, to the energy transformation, we’ve got it for you right here and right now!
Help us to improve EnergyNow, Give us your feedback
Privacy Policy | Terms of Use
Results for {phrase} ({results_count} of {results_count_total})
Displaying {results_count} results of {results_count_total}
More results…